Part 2) The Global Inflation Shock: How It Hit Every Wallet on Earth
An analysis of how the historic inflation surge of 2021–2024 triggered massive bond routs, aggressive central bank tightening, and created a more volatile structural reality for the remainder of the decade.
Part 1 outlined the three core drivers behind the inflation surge of 2021–2024. Part 2 examines how those forces reshaped financial markets, household finances, and central bank policy, creating a "New Normal" for the remainder of the decade.
The Historic Rout in Bond Markets
Bond markets were the first to absorb the shock. In a typical year, bonds act as a "safe haven," but 2022 was an anomaly. When inflation rose, the real value of fixed interest payments evaporated.
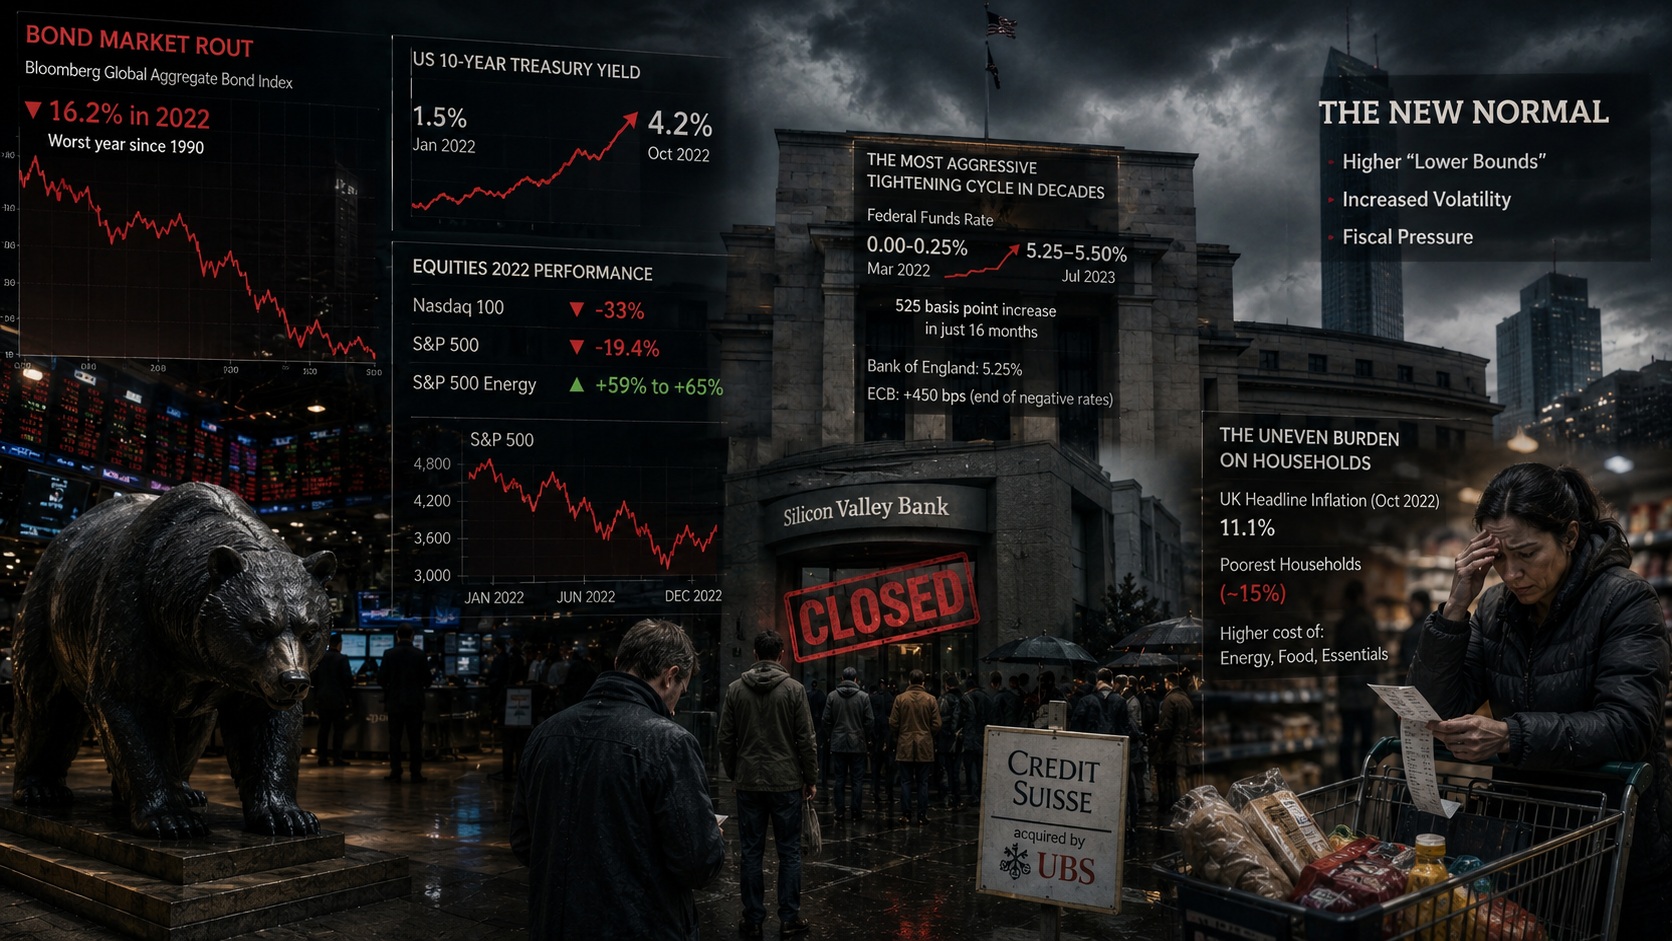
- Record Declines: The Bloomberg Global Aggregate Bond Index declined by 16.2% in 2022—its worst year since the index's inception in 1990.
- Yield Surges: The US 10-year Treasury yield, which began 2022 at roughly 1.5%, surged to over 4.2% by October.
- Duration Pain: Portfolios with long-duration bonds (maturities of 20+ years) saw losses exceeding 30%, creating a massive "paper loss" for pension funds and insurance companies.
Equities: Growth vs. Value
Higher interest rates reduce the "present value" of future cash flows, which hit high-growth technology companies hardest.
- The Tech Crash: The Nasdaq 100 plummeted by 33% in 2022 as investors fled expensive "growth" stocks.
- Broad Market Pain: The S&P 500 declined by 19.4%, ending a long bull market.
- The Energy Hedge: Conversely, the S&P 500 Energy sector rose by an extraordinary 59% to 65% in 2022, driven by the spike in oil and gas prices.
The Most Aggressive Tightening Cycle in Decades
The policy response was a "shock and awe" campaign to regain credibility. The Federal Reserve raised rates from 0.00-0.25% in March 2022 to a peak of 5.25–5.50% by July 2023—a 525-basis-point increase in just 16 months.
- Global Coordination: The Bank of England raised rates to 5.25%, and the European Central Bank (ECB) ended its era of negative rates, hiking by 450 basis points in total.
- The Breaking Point: This rapid tightening led to the March 2023 banking crisis, resulting in the collapse of Silicon Valley Bank and the forced merger of Credit Suisse.
The Uneven Burden on Households
Inflation acted as a "regressive tax," hitting the poorest hardest. Because food and energy make up a larger percentage of lower-income budgets, their "effective" inflation rate was significantly higher than the headline numbers.
- The UK Example: While headline inflation hit 11.1%, the poorest households faced an effective rate closer to 15% due to the concentration of price hikes in heating and basic groceries.
- The Wealth Effect: Higher-income households saw their net worth drop due to falling stock and bond prices, but their consumption remained stable, widening the social divide.
The Structural Shift
The shock of 2022–2024 ended the era of "Easy Money." We have entered a structural shift defined by:
- Higher "Lower Bounds": Interest rates are unlikely to return to 0% any time soon.
- Increased Volatility: Markets are now far more sensitive to geopolitical events, such as the 2026 Iran conflict, which has recently reignited energy price fears.
- Fiscal Pressure: Governments now face much higher costs to service their national debts, limiting their ability to spend on future crises.
The Final Lesson
Inflation is more than just a rising CPI number; it is a force that redistributes wealth, topples banks, and reshapes political landscapes. As we move through 2026, the primary lesson for investors and policymakers alike is that resilience and diversification are no longer optional—they are the only way to survive a more volatile global economy.